Dashboards display energy use
 Anyone connected to campus internet can monitor how much energy they’re consuming or conserving with the UIC Energy Dashboard.
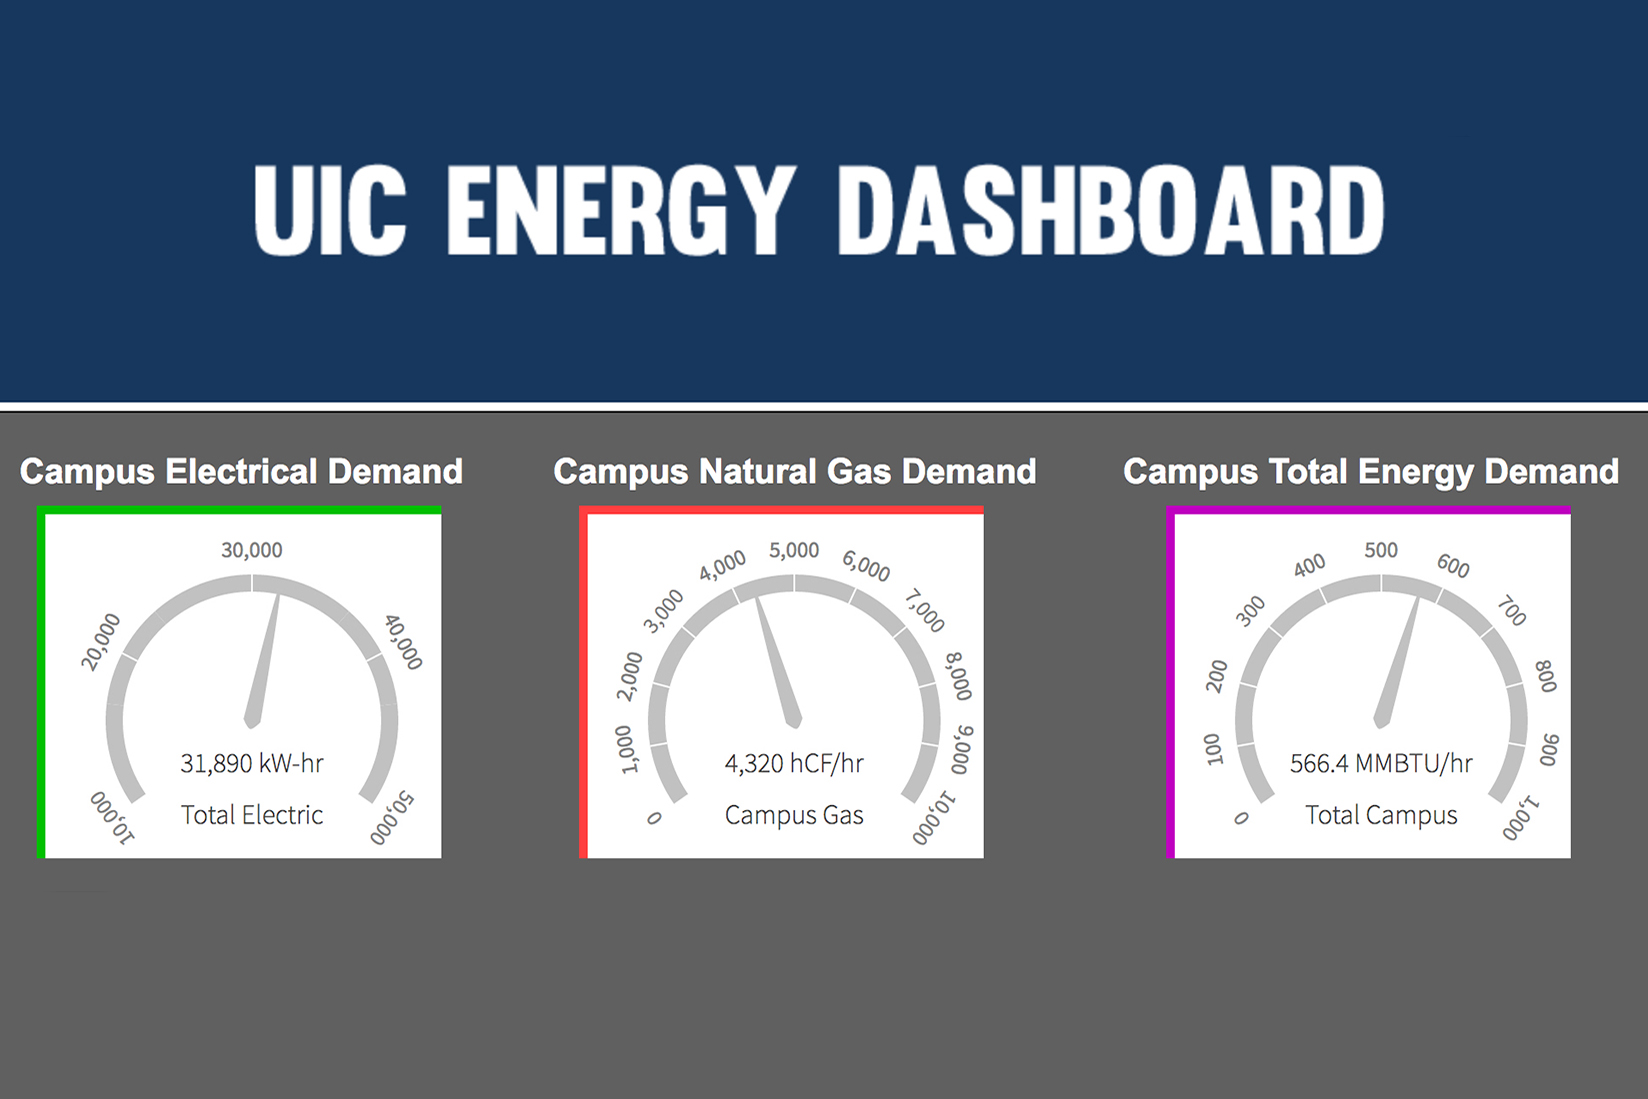
The dashboard, an improvement of a project launched in 2015, displays campus-wide or building-specific data recorded by smart meters, which electronically report energy use in real time. The tool lets users track UIC’s carbon dioxide emissions along with electrical, cooling, heating and natural gas demands.
“It allows you to access that data virtually immediately to see what’s happening,” said Cynthia Klein-Banai, associate chancellor for sustainability.
The university’s investments in building automation systems, which control heating, ventilation and air conditioning on campus, helped UIC personnel build the dashboard, said Sandeep Dath, director of technology and building systems.
Upgrades in core software, including a new analytics platform, modifications of graphics and navigational services, and added campus-wide data streams also make the new UIC Energy Dashboard a “more robust and relevant system,” said Aaron Mason, building automation systems contractor for utilities.
“It’s not just a single page — it’s like an interactive application,” Dath added.
After logging on, visitors are greeted with a landing page that provides energy-use totals for UIC’s east and west sides. From there, users can select up to 13 buildings to monitor energy use.
Campus leaders hope the dashboard will inspire students, faculty and staff to help UIC achieve its climate commitments.
“One of the ways that we can encourage awareness around energy use and environmental impacts of energy use is for people to visualize what they’re actually using because it’s such a nontangible type of thing,” said Klein-Banai. “It can lead to better stewardship of those resources.”
Indices, like the Sparky D. Dragon Index, easily explain how much energy a building is consuming. A link to the Office of Sustainability’s website also provides a list of energy-efficient habits people can implement to achieve reductions.
“We’re trying to put it in a context where they can see how much the building is using now compared to average, how much it’s using now compared to what it used in the past, so people can say, ‘Oh, today we were using a lot of energy, maybe I can cut back on something. I should be more aware of what I’m doing,” Klein-Banai said.
The dashboard will be displayed in building kiosks by fall semester.
