SenePy-figure
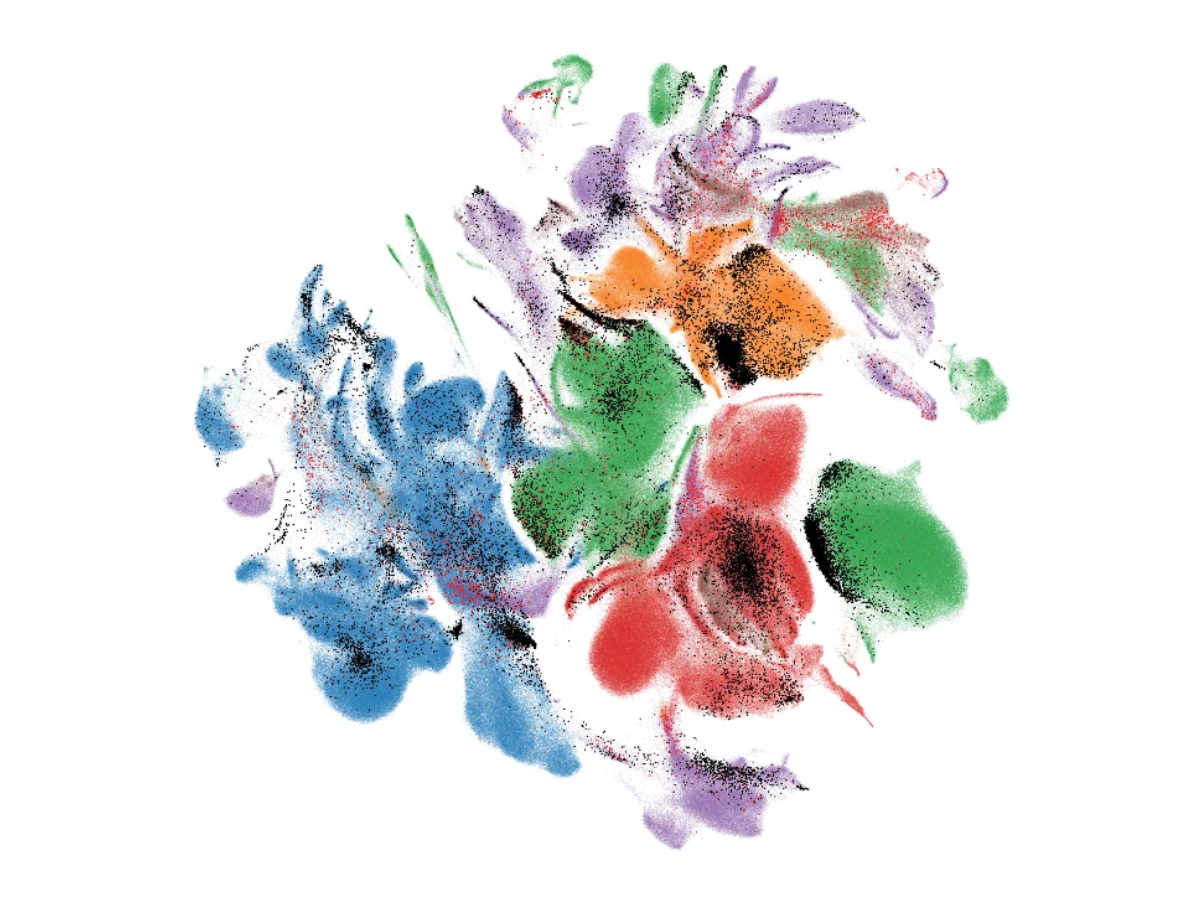
A UMAP visualization showing senescent cells among healthy cells from different human tissues.(Graphic: Sanborn et al)

A UMAP visualization showing senescent cells among healthy cells from different human tissues.(Graphic: Sanborn et al)