Using a Community Vulnerability Index for COVID-19 vaccination
The UIC School of Public Health’s Public Health Geographic Information Systems (PHGIS) program will be presenting a series of Midwest Comprehensive Visualization Dashboards focusing on public health issues of COVID-19 in this region. The dashboards create visualizations that lead to operational insights that enhance data-driven decisions about mitigation efforts to eradicate COVID-19. They were explicitly designed to overcome some of the limitations identified in the plethora of dashboards appearing in response to the pandemic. This is the third dashboard produced by our team, which addresses COVID-19 vaccinations and provides information to assist public health professionals with the difficult task of prioritizing vaccinations and monitoring progress of vaccinations in Cook County, Illinois. The operational parameter that is included in this dashboard is a measure of vulnerability in the form of a social vulnerability index.
Vaccine prioritization frameworks
The National Academies of Sciences, Engineering, and Medicine (NASEM) recommended a four-phase framework for equitable COVID-19 vaccine allocation. For the latter phases, NASEM made the specific recommendation that “vaccine access should be prioritized for geographic areas identified through CDC’s Social Vulnerability index or another more specific index.”
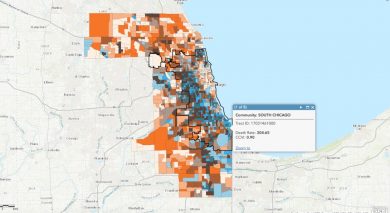
The CDC’s Social Vulnerability index (CDCSVI) is one of the many indices in use aiming to “help local officials identify communities that may need support before, during, or after disasters.” This index, which is constructed from census data at various scales of aggregation, seeks to classify the relative social vulnerability of a location to a hazard-based on a combination of factors. The CDCSVI has a separate set of rankings for census tracts and counties according to 15 social attributes obtained from the American Community Survey, including unemployment, minority status and disability. The CDCSVI groups these attributes into four related themes: socioeconomic status, household composition and disability, minority status and language, and housing type and transportation.
A notable strength of the CDCSVI is the ease with which public health agencies can obtain the CDCSVI ranking of their location from the well-organized CDC portal. From the perspective of planning and resource allocation, social vulnerability is presumed to be an indicator of a community’s potential risk for COVID-19, along with the need for additional resources to mount mitigation efforts against the pandemic.

Categories