For researchers tackling inequities, maps are a powerful tool
Inequities within communities come in all shapes and sizes.
At the surface level, some are easy to spot, such as investments in shiny new construction in one neighborhood and neglect in another. The root causes can be pernicious and need to be teased out through complex analyses. Yet analyses alone rarely are enough to make an impact; results need to be conveyed to the public in a way that paints a clear picture.
So, researchers who study inequities with the goal of reducing them often turn to maps. Maps are easily understood, they can reveal patterns that aren’t always apparent in the raw data and they can be useful for advocates and policymakers who are eager to make meaningful changes. That’s why faculty across the University of Illinois Chicago who study inequities often use maps both as a research tool and a data visualization in support of positive change.
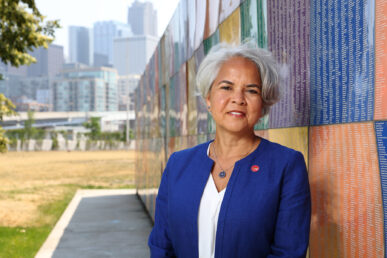
“Maps empower us, as researchers, and the community members we partner with, to take proactive rather than mitigative approaches to public health problems,” said Marie Lynn Miranda, chancellor and professor of pediatrics at UIC. Miranda also is director of the Children’s Environmental Health Initiative, which leverages maps as a research, outreach, and education tool.
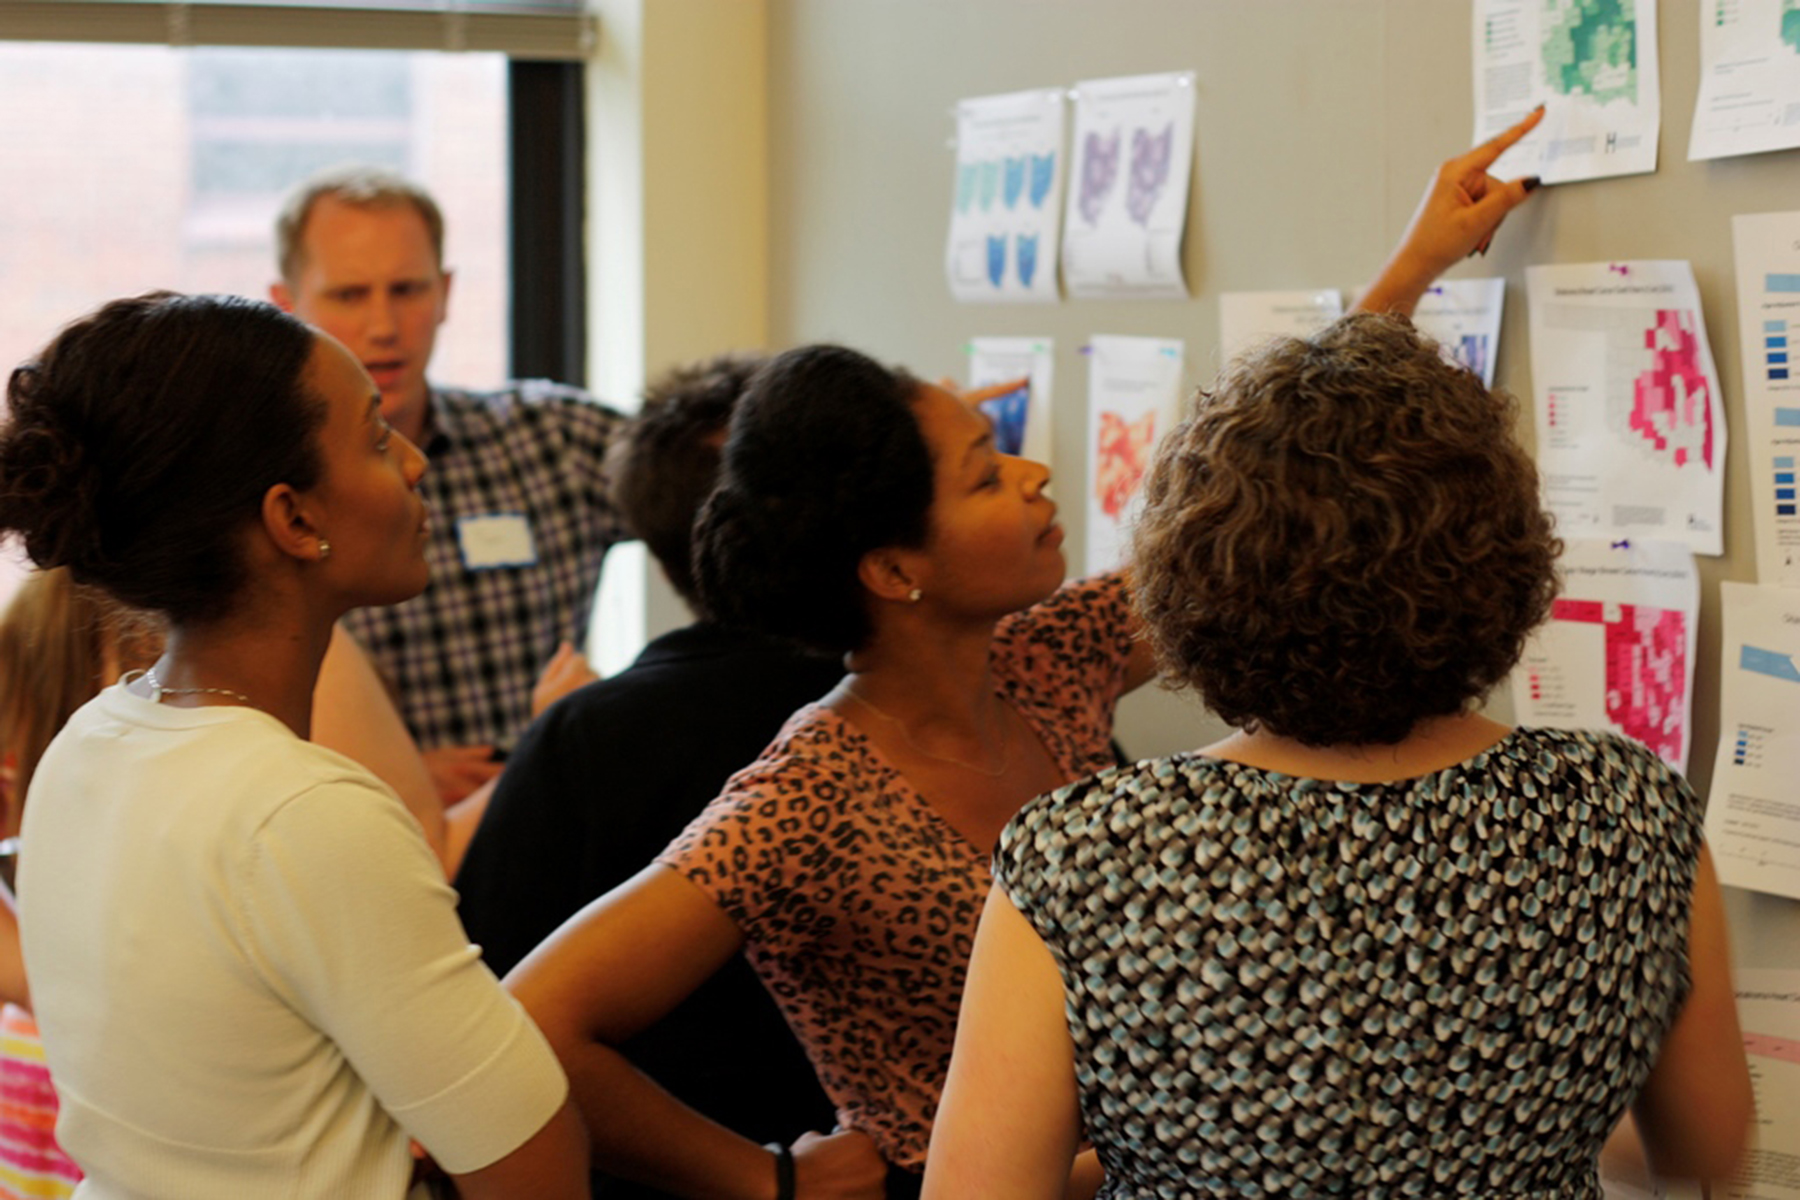
CEHI’s work often involves linking and plotting spatial data from environmental, social, and health datasets onto maps. This allows the researchers — as well as public health officials and community members — to understand the role of, for example, exposure to lead-based paint in shaping disparities in test scores and health outcomes.
“Maps are a great way of connecting people with data,” explained Joshua Tootoo, director of training and geospatial sciences at CEHI. “It takes something abstract like lead exposure risk and it becomes real when you put those risk scores on a map. A community member can find their house. They can see the park where their kids play every day.”
CEHI, which moved to UIC along with Miranda this summer, joins a number of research initiatives at UIC that use maps to address inequities in areas ranging from transportation to environmental justice to disability rights.
Where the sidewalk ends
When Fabio Miranda, assistant professor of computer science, started working on a project on skyscraper shadows, he didn’t realize he’d also be helping those with mobility limitations navigate the sidewalk.
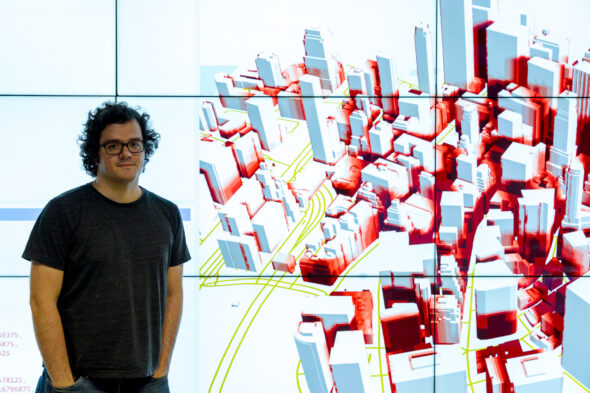
As a PhD student, Miranda (no relation to the chancellor) helped create a visual analytics tool called Shadow Profiler. It allowed architects and urban planners in New York City to see the shadows that buildings cast, as well as the potential shadows of proposed construction.
The tool was featured in the New York Times, where it caught the eye of an occupational therapist. She told the researchers that she was printing out maps from Shadow Profiler for elderly clients, pinpointing where they should avoid walking in winter because shadows mean a higher likelihood of icy sidewalks and falls.
By the time he learned of this unexpected use, he and collaborators at MIT were working on another project specifically focused on sidewalks: creating an algorithm that takes images from Google Street View and determines what materials the sidewalks are made of, which plays a large role in their condition. And the condition of sidewalks, of course, matters a lot to those with mobility limitations.
A subsequent project used machine learning to map out sidewalk networks — data that is not readily available in many cities.
“We are able to generate very reliable sidewalk networks from an aerial image using machine learning,” Miranda said. He and his colleagues have collected these and other visual analytics tools and data at Urban Toolkit for use by others interested in studying the urban environment.
Yochai Eisenberg, an assistant professor of disability and human development in the College of Applied Health Sciences, also works on sidewalk maps to help those with mobility limitations. His work looks at how well communities are meeting the infrastructure requirements of the 1990 Americans with Disabilities Act.
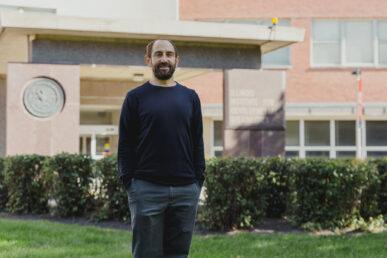
“There is a lot of research showing that people with disabilities experience barriers in the built environment when there was a law passed to address these issues over 30 years ago,” he said.
People cite these barriers — such as uneven pavement or the lack of curb ramps connecting sidewalks to crosswalks — as a reason why they don’t move about their communities more for work or fun. Most communities, however, don’t have a good way to collect data on the thousands of miles of sidewalks they oversee, Eisenberg said. So, even if they are motivated to be ADA-compliant, it can be difficult to know where to focus their energies. Taken together, this means that people with mobility limitations have a poorer quality of life, and communities open themselves up to lawsuits for their lack of ADA compliance.
Eisenberg, who is part of the Great Lakes ADA Center at UIC, along with colleagues at the University of Washington, has devised a crowd-sourced tool to improve the situation for everyone. They have two grants from the National Science Foundation to help build and promote Project Sidewalk, an interactive map that catalogs where barriers to travel exist.
“The maps are a way to understand how equitable the distribution of infrastructure is,” he said.
Users don’t need to be out and about to log information; it’s all done via computer. After a short tutorial, users are shown an intersection and can move their view around to all four corners to log, for example, the quality of curb ramps and surface condition. Then they can “walk” to the next intersection while continuing to rate sidewalk conditions.
The researchers have worked with community colleges and other local organizations to get people involved in crowdsourcing. The maps currently exist in 10 cities in the U.S., Mexico and the Netherlands, including Chicago. The researchers are focusing their outreach on under-resourced communities that likely can’t take on this work themselves.
“It’s a way to help in areas where they don’t have the capacity and funding to collect this data,” Eisenberg said. Some municipalities already have used Project Sidewalk’s data to apply for infrastructure grants to help remove barriers and make sidewalks safer.
Finding the gaps
Of course, sidewalks aren’t the only means of transportation that can create issues of equity, or that lend themselves to having those issues plotted out on a map.
P.S. Sriraj, director of UIC’s Urban Transportation Center, and Nebiyou Tilahun, an associate professor of urban policy and planning, conduct research aimed at helping policymakers and planners create more equitable communities.
One of Tilahun’s mapping projects, the Metropolitan Chicago Accessibility Explorer, lets users explore how easy it is to get to different types of locations, such as jobs, parks, and grocery stores, by car, bike, public transit, or on foot.
Mapping data in this nuanced way, where it combines information on access to transit as well as where people plan to go, reveals patterns that would be missed with other sorts of analyses. For example, simply counting the number of transit stops in an area would fall short of creating a full picture of transit equity.
“A planner could look at the number of bus stops in the neighborhood and say it’s good. But just because you have a bus stop in front of your home doesn’t mean it will take you where you want to go,” Sriraj said.
For example, their research has shown that while there are plenty of transit options available in the south and southwest Chicago suburbs, they don’t connect people to Joliet and Monee, where there are jobs available.
Sriraj and Tilahun, both of the College of Urban Planning and Public Affairs, have collaborated on a project looking at the “last mile” problem. This is when there’s a gap between where a person starts their commute and their first transit stop or a similar gap at the other end of the trip.
People may not feel safe walking that last-mile gap in high-crime areas or where sidewalks or intersections are poorly maintained, the researchers explain, which limits where people travel. Sriraj and Tilahun are currently working to map those gaps across the Chicago area.
“Planners want to make sure that people have access to the things and activities that they want to engage in,” Tilahun said. “The goal of our research is for policymakers or planners to see where the gaps are so they can decide how to improve things.”
Maps and environmental justice
Part of the reason that mapping is such an effective research tool is that people’s “map IQ” has improved so much in recent years, said Tootoo of the Children’s Environmental Health Initiative.
“Everyone has a map in their pocket now,” he said.
Michael Cailas, associate professor in the School of Public Health, agrees. He and colleagues have created a number of maps that identify disparities in the location of potential polluters in Chicago as part of the Public Health Geographic Information Systems program.
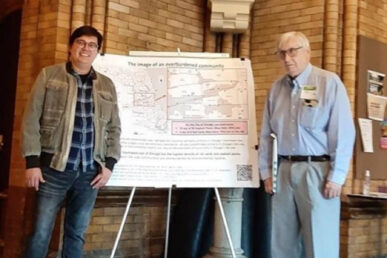
“Environmental justice is the equitable distribution of these environmental burdens within communities,” he said. The best way to show that distribution to the community is on a map.
His team includes others from the School of Public Health, as well as Phillip Boda from the College of Education, and Fabio Miranda, the computer scientist at the College of Engineering who studies sidewalks. Together, they create community-oriented maps of environmental burden, making sure to include prominent neighborhood landmarks like churches and schools so that residents can quickly locate their homes.
“Once you see that your house is two blocks away or three blocks away from a pollution source, that brings a completely different perspective to the problem,” Miranda said. “You wouldn’t feel as connected otherwise.”
CEHI also uses maps to empower the communities they study.
Much of CEHI’s work involves combining giant datasets that contain geospatial data so the information can be layered on top of one another to paint a more comprehensive picture of the cumulative burden facing communities. For example, residential address data links blood tests for children’s lead levels and children’s standardized test results. Additionally, the researchers have created a local, spatial measure of racial isolation of minoritized groups by using U.S. Census data on the racial composition of the area where a person lives as well as surrounding areas. Using that measure, CEHI can identify racially isolated locales where most of the neighbors of non-Hispanic Black individuals are from the same racial group as they are.
“By combining all this spatial information, we can start to build a story about what’s happening in a person’s life,” Tootoo said.
The goal is to go beyond observations such as that lead exposure is higher on average for Black Americans than white Americans, explains Melissa Fiffer, senior research scientist with CEHI. Instead, it’s to see the interplay of various environmental factors and social stressors that result from a long history of structural racism in the U.S., all of which have shaped where people live. These exposures, in turn, contribute to health and education outcomes.
Once these exposures are identified, they can be targeted for improvement.
“These are exposures that we can potentially modify,” Fiffer said, “as opposed to a child’s race or ethnicity, which doesn’t change.”
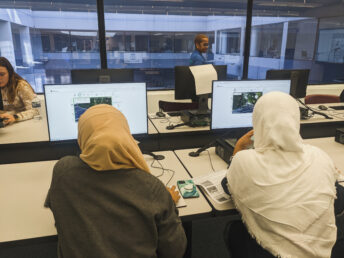
Because these mapping tools are so useful, CEHI is committed to ensuring that public health officials know how to use them. They offer workshops for state, local, and tribal epidemiologists to give them the technical know-how to run their own analyses. This ensures that more and more people are able to use maps to investigate — and hopefully improve — inequities near them.
“UIC researchers’ unique combination of mapping expertise and commitment to social change inspires me daily,” Chancellor Miranda said. “Maps help tell the stories of the diverse, urban communities who partner with us to understand and subsequently work to eliminate inequities.”
